Streamflow forecasts tell you what the water will do. Flood intelligence tells you what that means on the ground. Lynker Spatial translates multi-model discharge predictions into inundation extents, asset impact, and 44-year frequency analysis, so your team can respond to what's coming, not just measure what arrived.
Decision-support tool. Does not constitute an official flood warning, evacuation order, or emergency directive. See platform disclaimer.
Flood extents can be driven by any model in the hydro-intel stack: NWM, HEC-RAS libraries, FastPLN, or custom Lynker Spatial simulations. Pilot deployment covers HUC 10190007 (Fort Collins, CO); CONUS rollout in progress.
NOAA's National Water Model forecasts discharge at millions of reach segments across the country. That number (cubic feet per second) is essential for hydrologists, but it doesn't answer the question an emergency manager or utility operator needs to answer: which roads are passable? Which substations are threatened? Which neighborhoods should be warned?
FEMA flood maps show the 1% annual chance extent. They don't show what yesterday's storm produced, or what tomorrow's forecast implies for a specific channel crossing. RFC flood stage thresholds exist for major gages, but they don't extend to the thousands of unmonitored tributaries where the first infrastructure contact happens.
Lynker Spatial Flood Intelligence closes that gap. We translate discharge from operational forecasts or retrospective simulations into spatial flood extents using a nationally consistent inundation library built on the Lynker Spatial Hydrofabric. Every catchment on the network is a potential output point. Every forecast becomes a map.
And the opportunity is larger than any single model. The NWM is one input. HEC-RAS engineering studies represent decades of authoritative hydraulic analysis for thousands of studied reaches. Newer approaches extend coverage into the ungaged and data-sparse reaches where legacy models don't exist. No single method wins everywhere, but the Hydrofabric provides the connective tissue that lets all of them speak the same spatial language. The result is a national inundation mosaic: the best available method for every reach, delivered through a consistent interface, at a scale no single model family could achieve alone.
Not every flood question has the same answer, and not every answer comes from the same model. Different watersheds, data environments, and decision timelines call for different methods. We match the approach to the context and deliver a consistent spatial output regardless of what's running underneath.
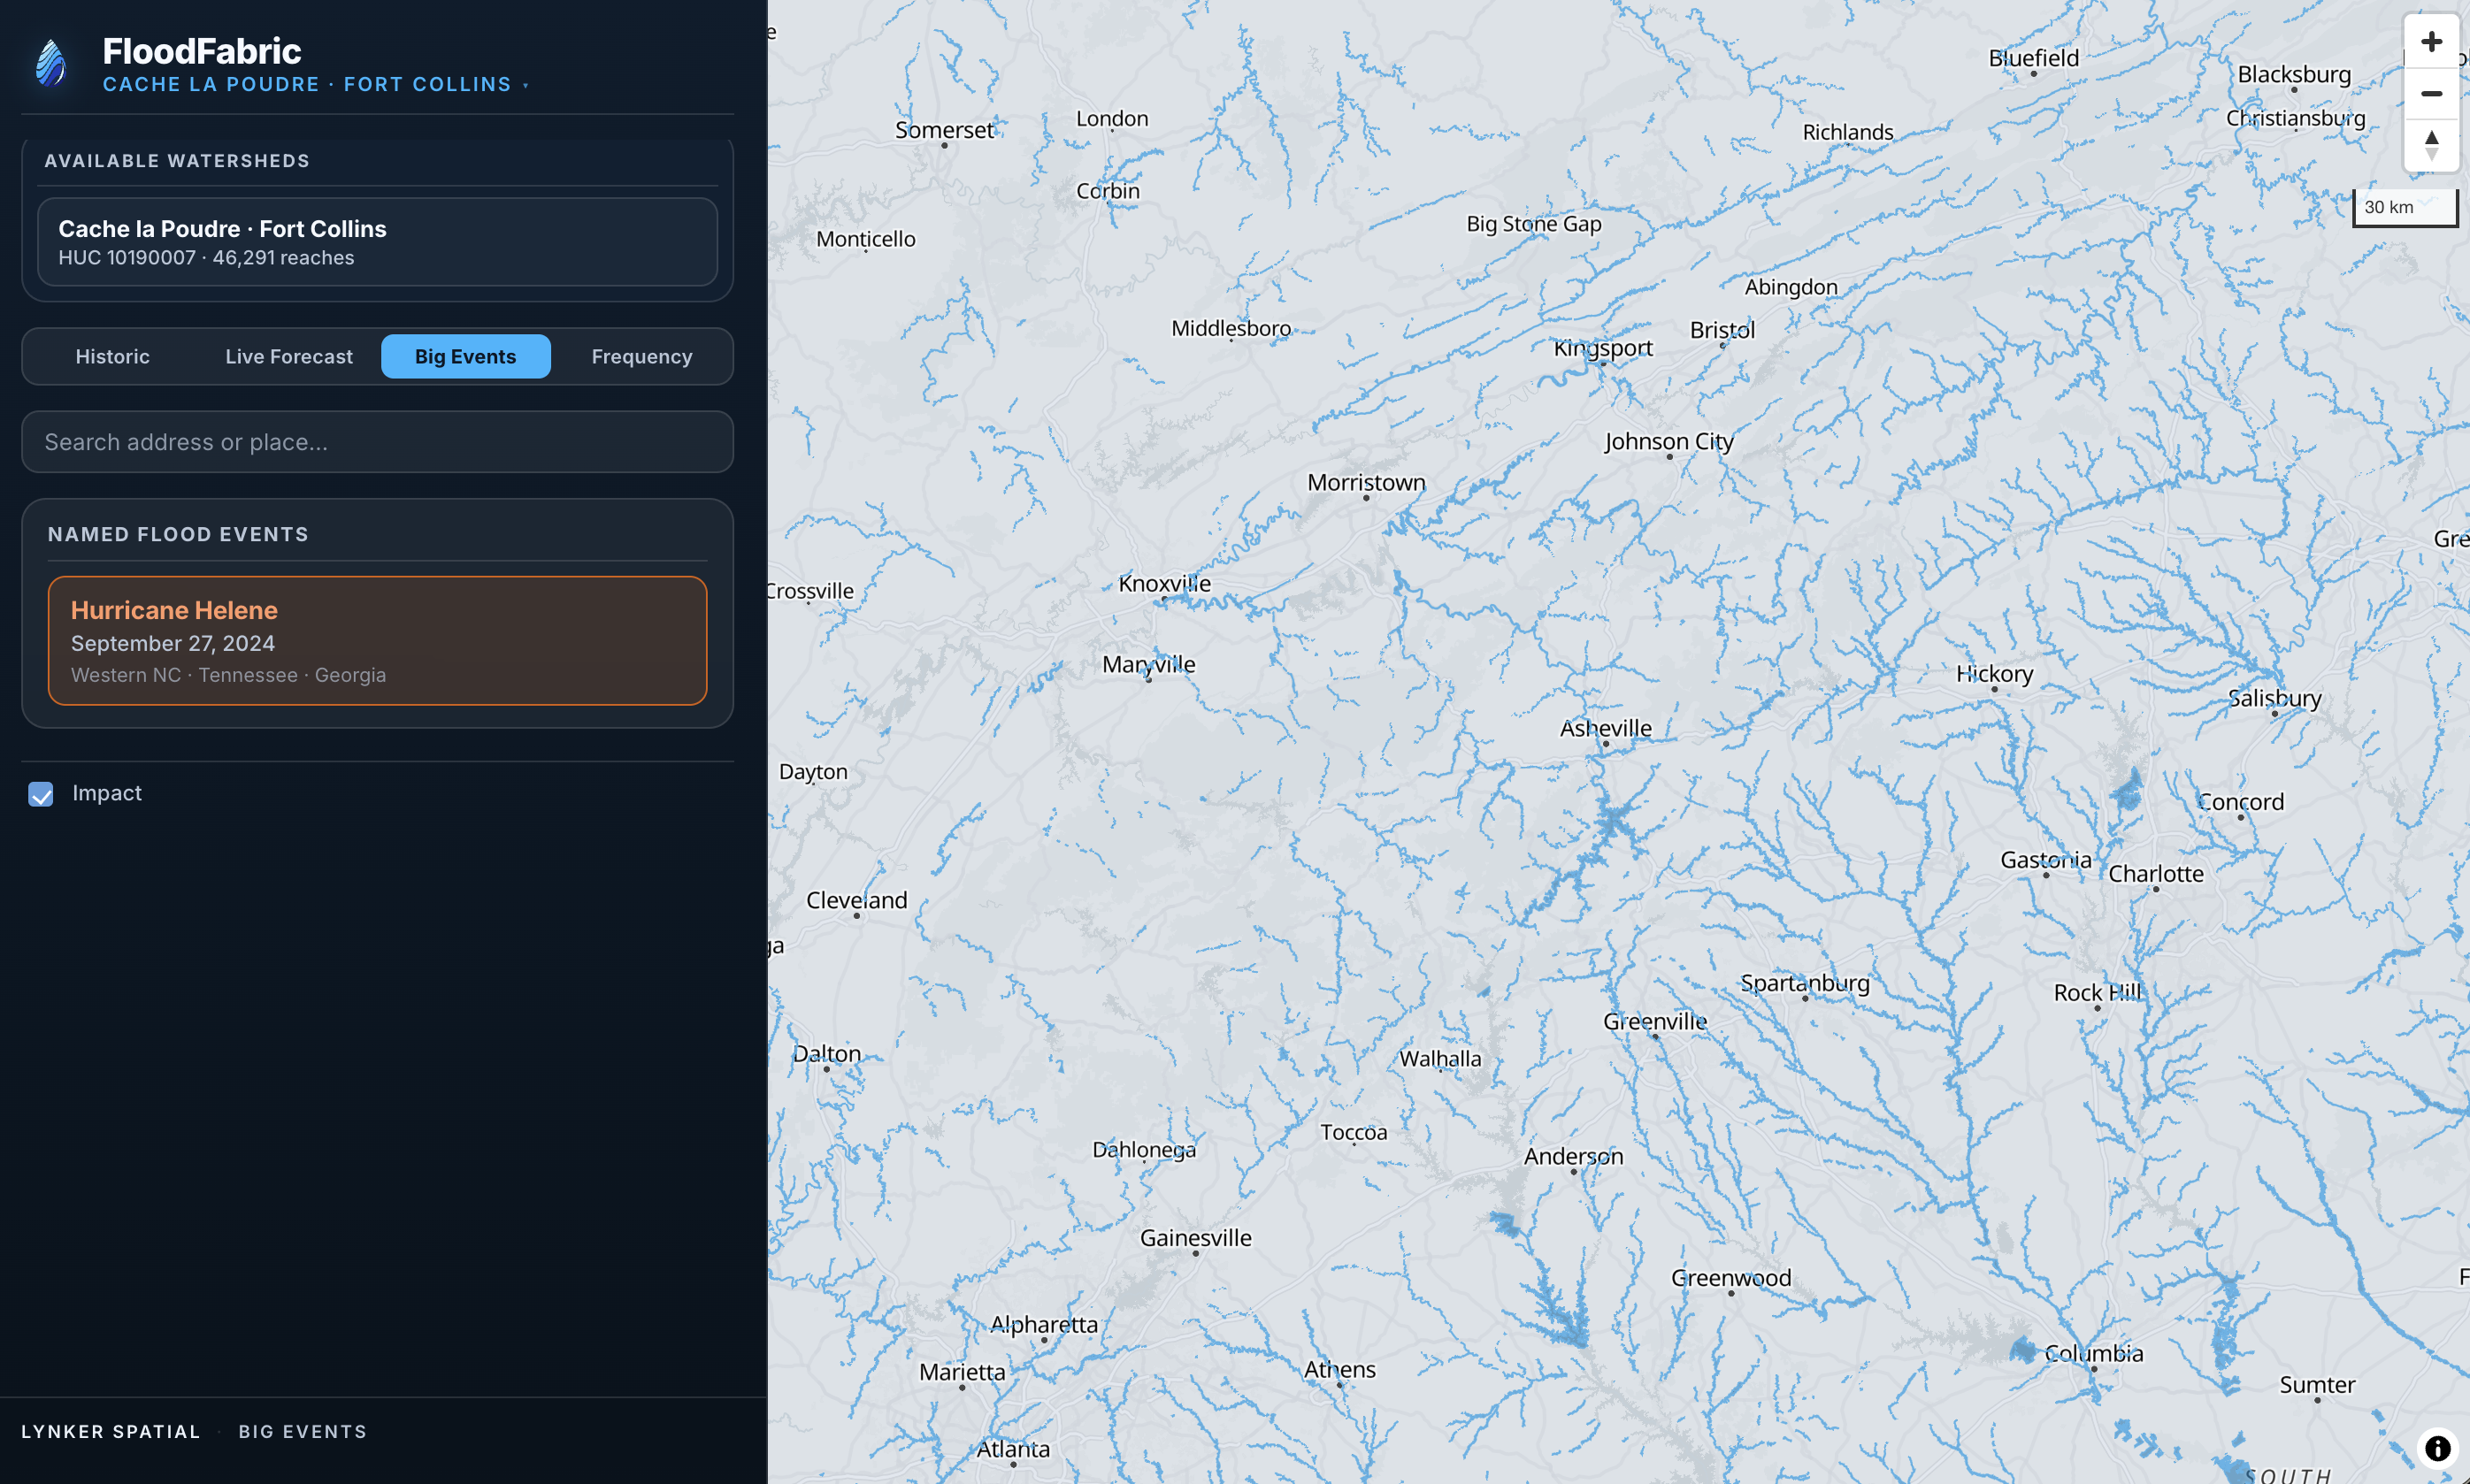
State-of-the-science operational forecasting from NOAA, optimized for national coverage and delivery speed. The right choice when consistency across the full river network matters more than site-specific precision.
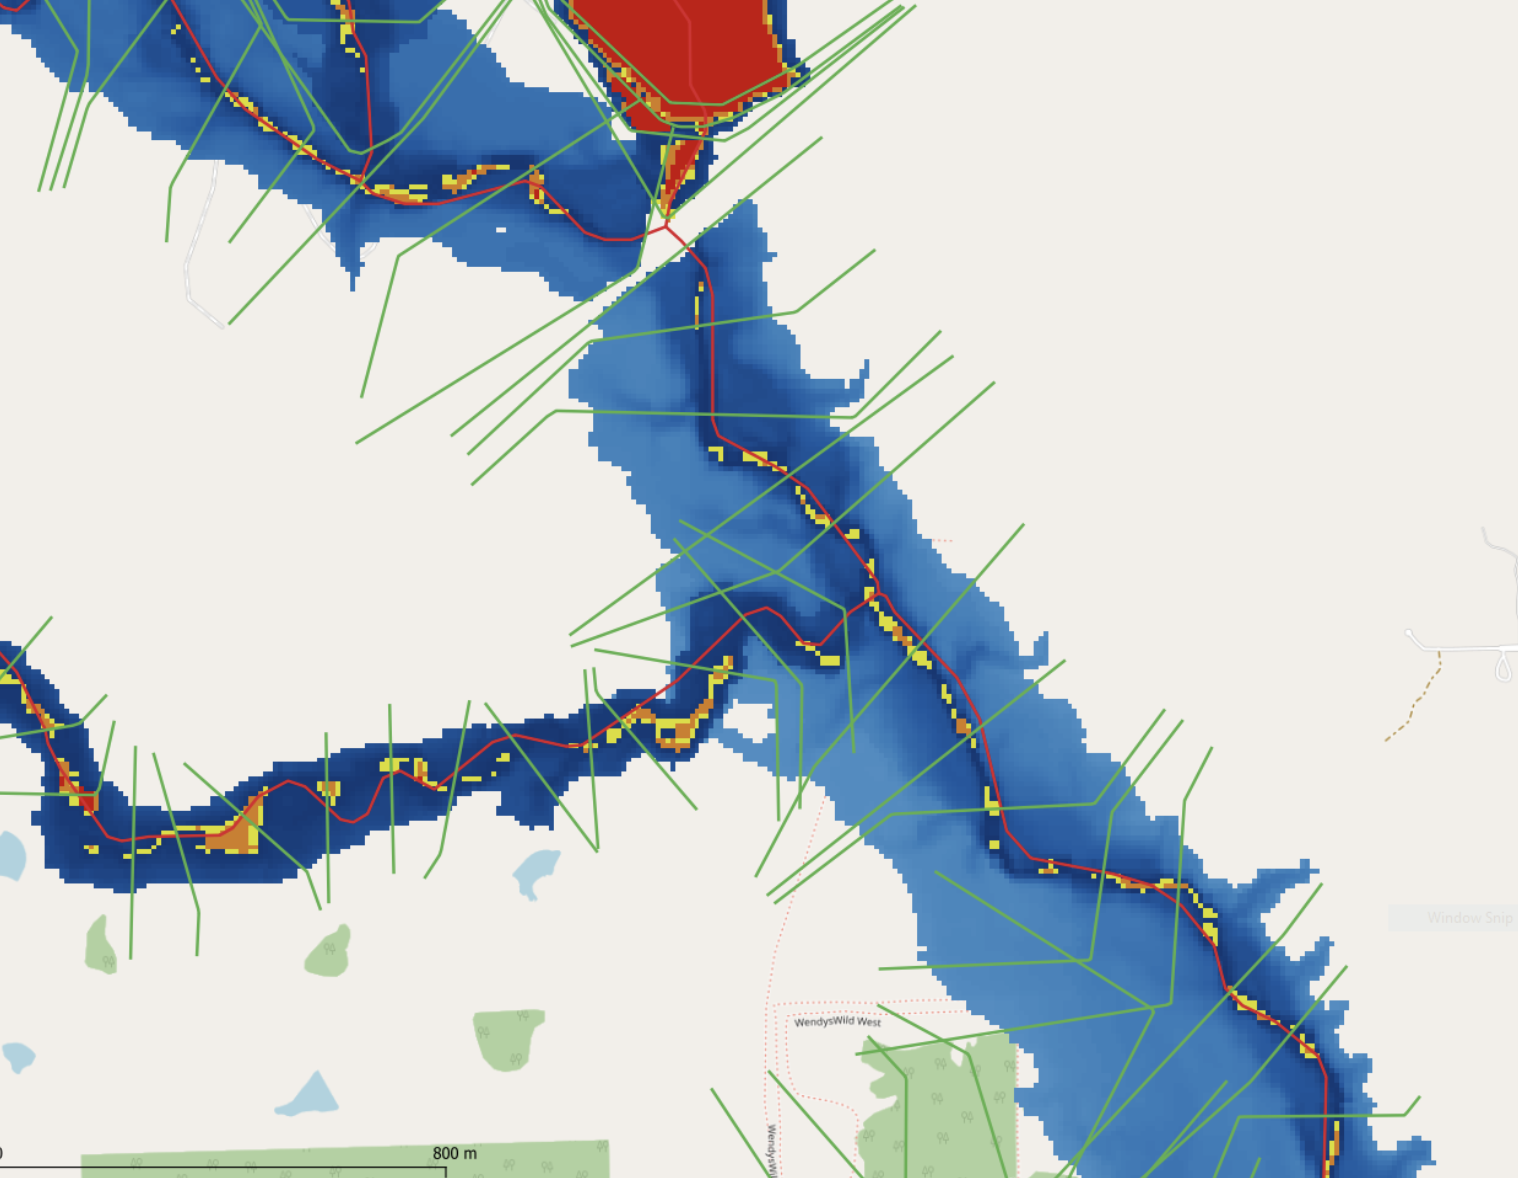
Existing HEC-RAS hydraulic models represent the authoritative engineering record for thousands of studied reaches. RAS2FIM exposes that prior investment as a queryable inundation library, bringing decades of established hydraulic analysis into a modern, programmatic delivery layer.
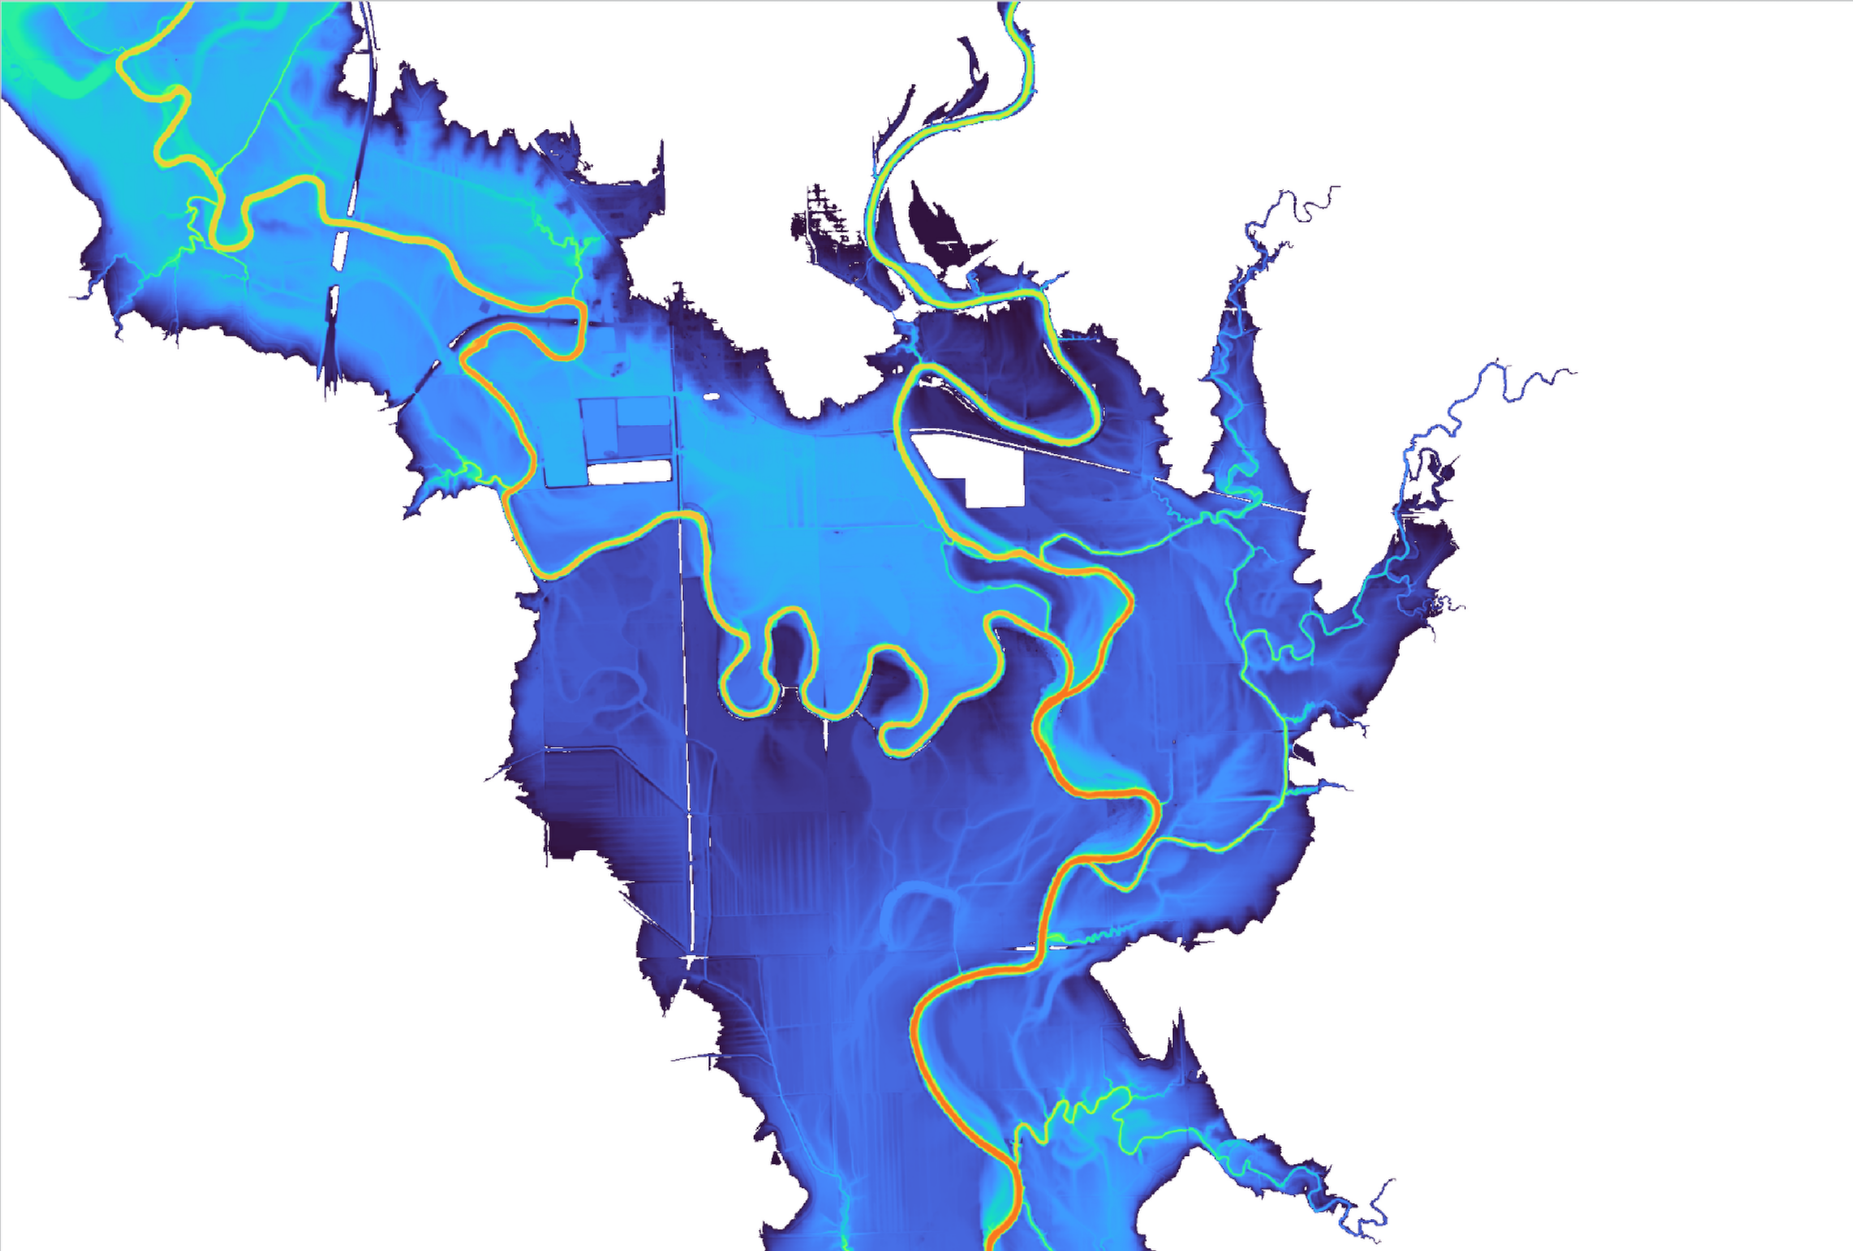
Purpose-built for speed and scale where neither operational NWM outputs nor existing engineering models are available. Delivers rapid inundation estimates across ungaged and data-sparse reaches where the need is highest.
The FloodFabric pilot covers HUC 10190007, the Cache la Poudre watershed upstream of Fort Collins, Colorado. A snowmelt-dominated system with active spring flood risk and a dense road and infrastructure network where impact analysis is most meaningful.
Two views of the same watershed: A historical mode lets you step through 44 years of daily retrospective simulations to understand what past flood events looked like spatially: which roads, which parcels, which corridors. A live mode shows current and near-term forecasts from multiple models simultaneously, with overlap where they agree and divergence where they don't. Click any flooded area to surface asset impact counts and inundated area estimates.
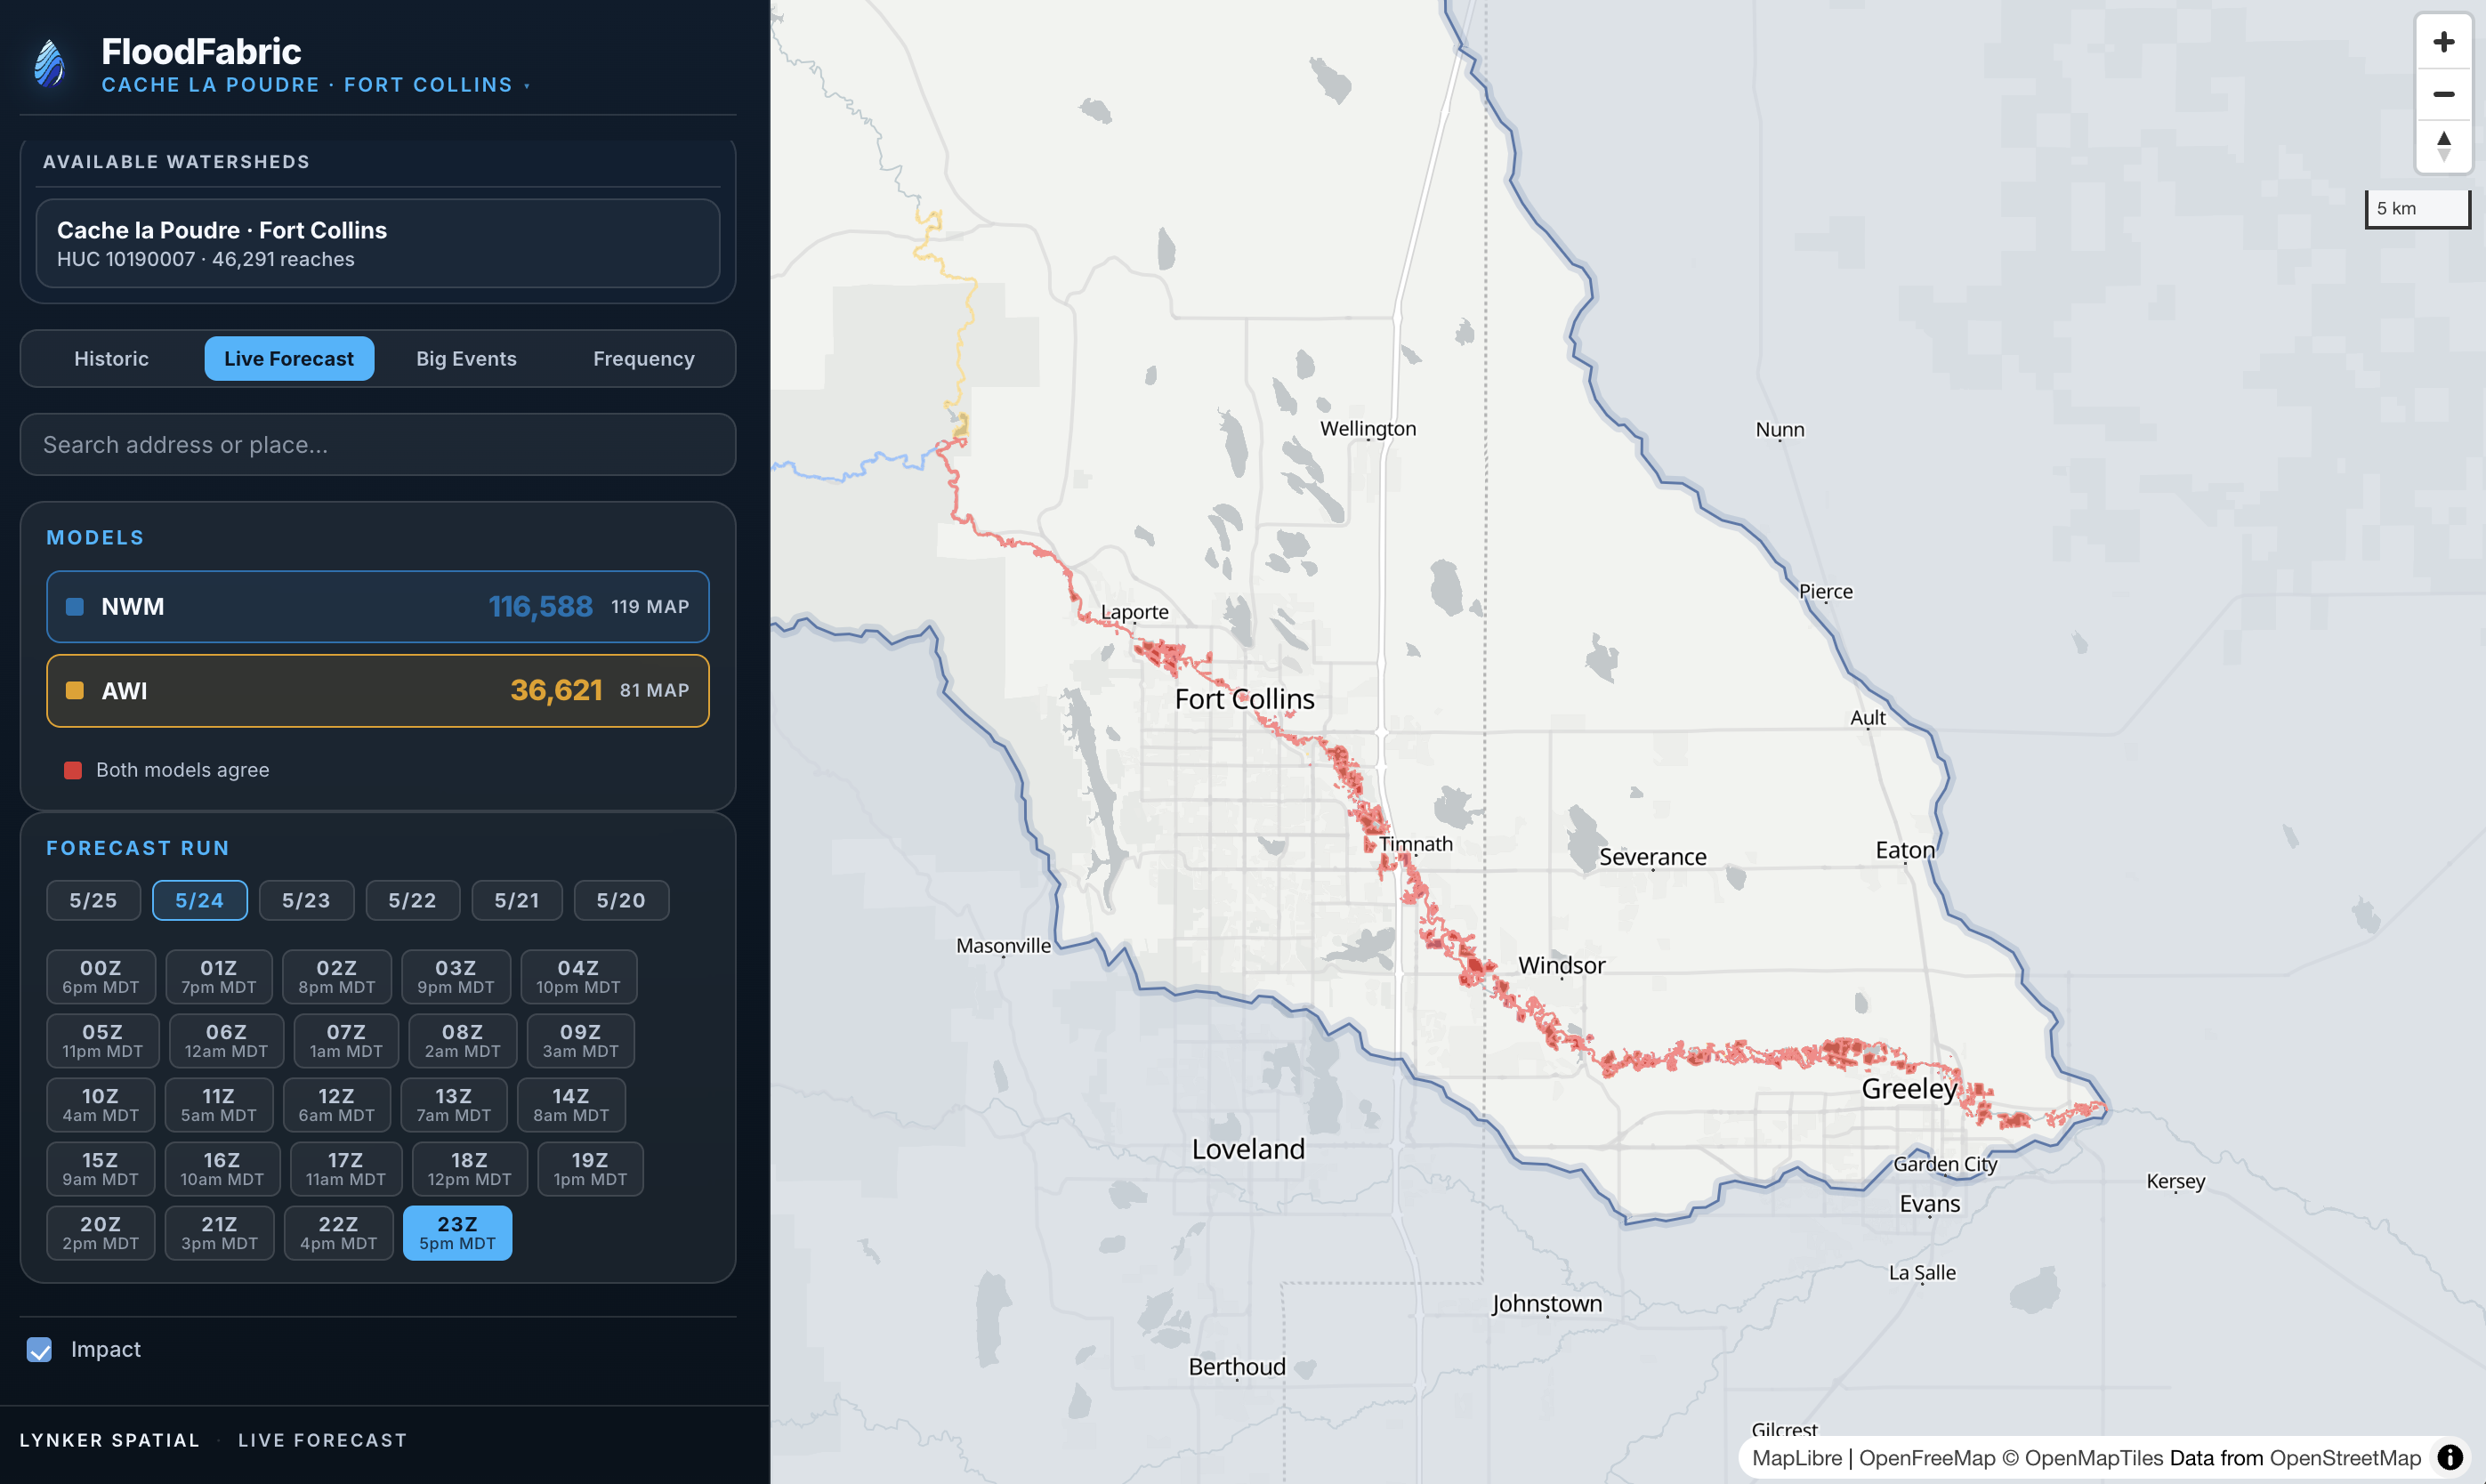
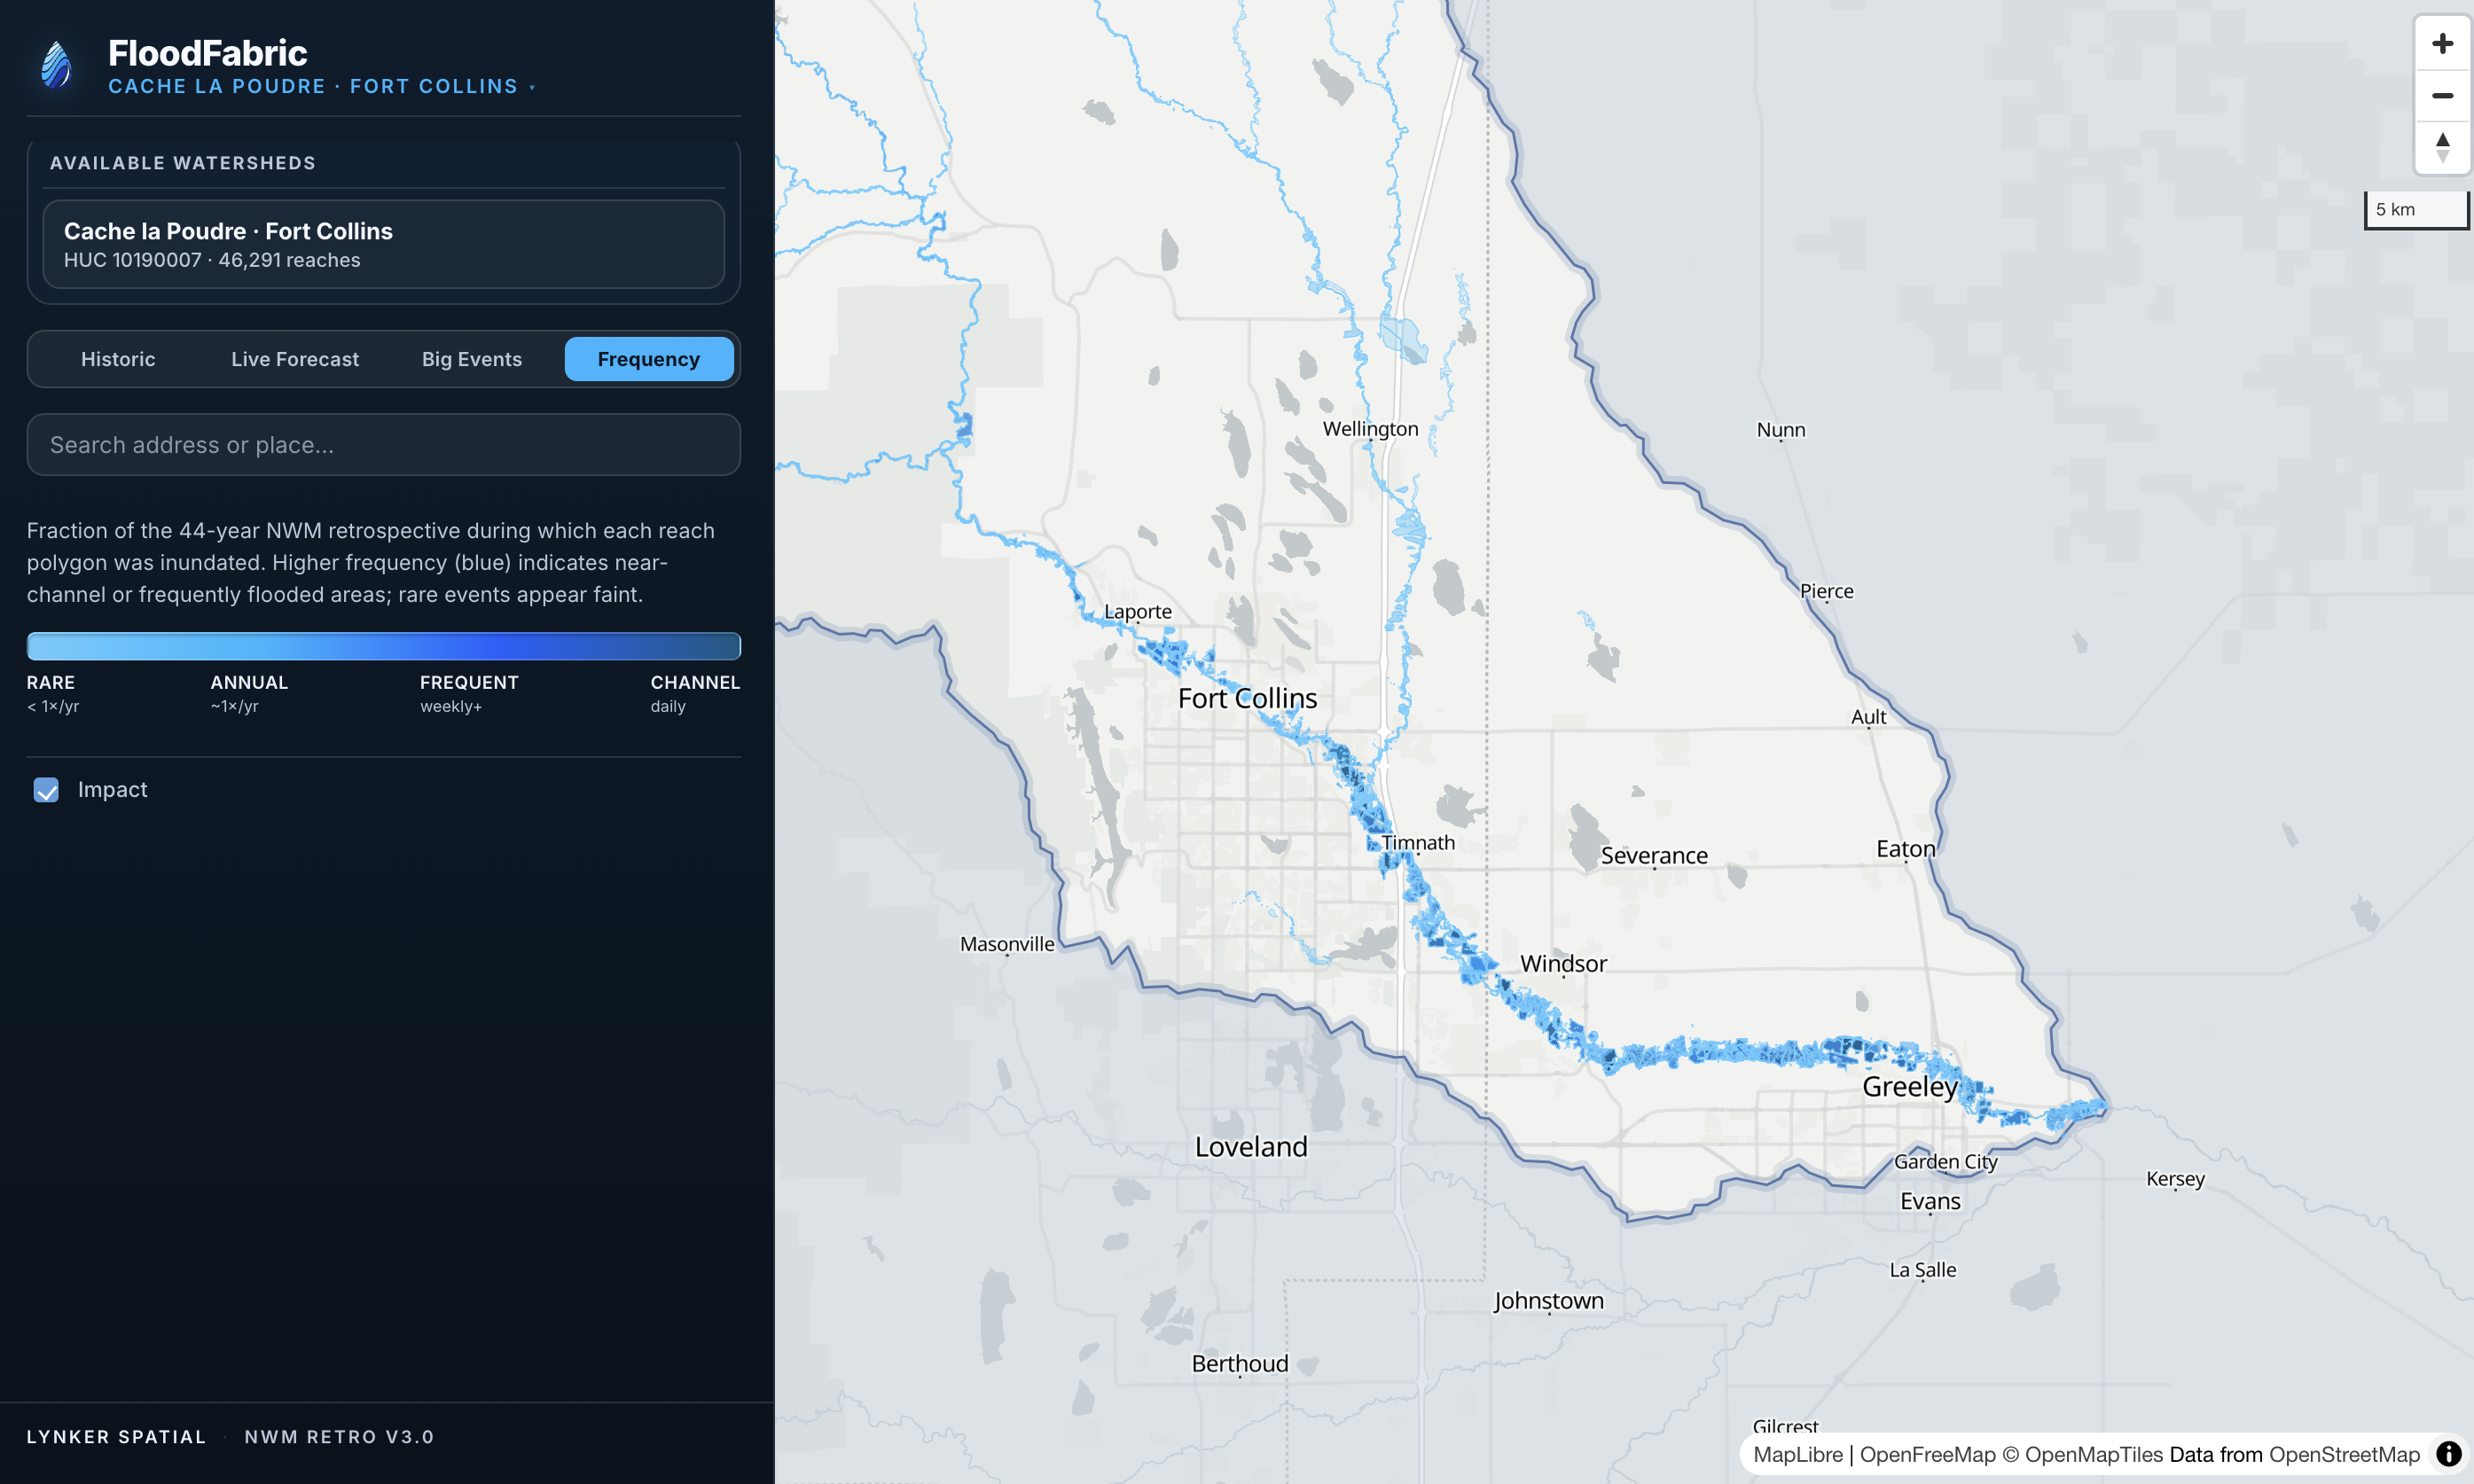
Fort Collins pilot · HUC 10190007 · NWM v3 reanalysis 1979–2022 + NWM short-range & AWI live forecasts. CONUS architecture in progress.
Real-time forecasts answer "is it flooding now?" Frequency analysis answers "how often does this road segment flood, and for how many days a year?" Those are different questions, and the second one is often more important for infrastructure investment, permitting, and long-range planning.
The FloodFabric retrospective pipeline processes NWM v3 reanalysis from February 1979 through 2022. Every day with a peak discharge that exceeds an inundation threshold generates a polygon set. Those sets accumulate into a per-polygon count of days inundated: a spatial frequency map distinguishing the rarely-wet floodplain fringe from the perennially-active mainstem corridor.
Paired with the live forecast layer, frequency context lets responders distinguish a routine high-flow event from a historically unusual one without waiting for post-event analysis.
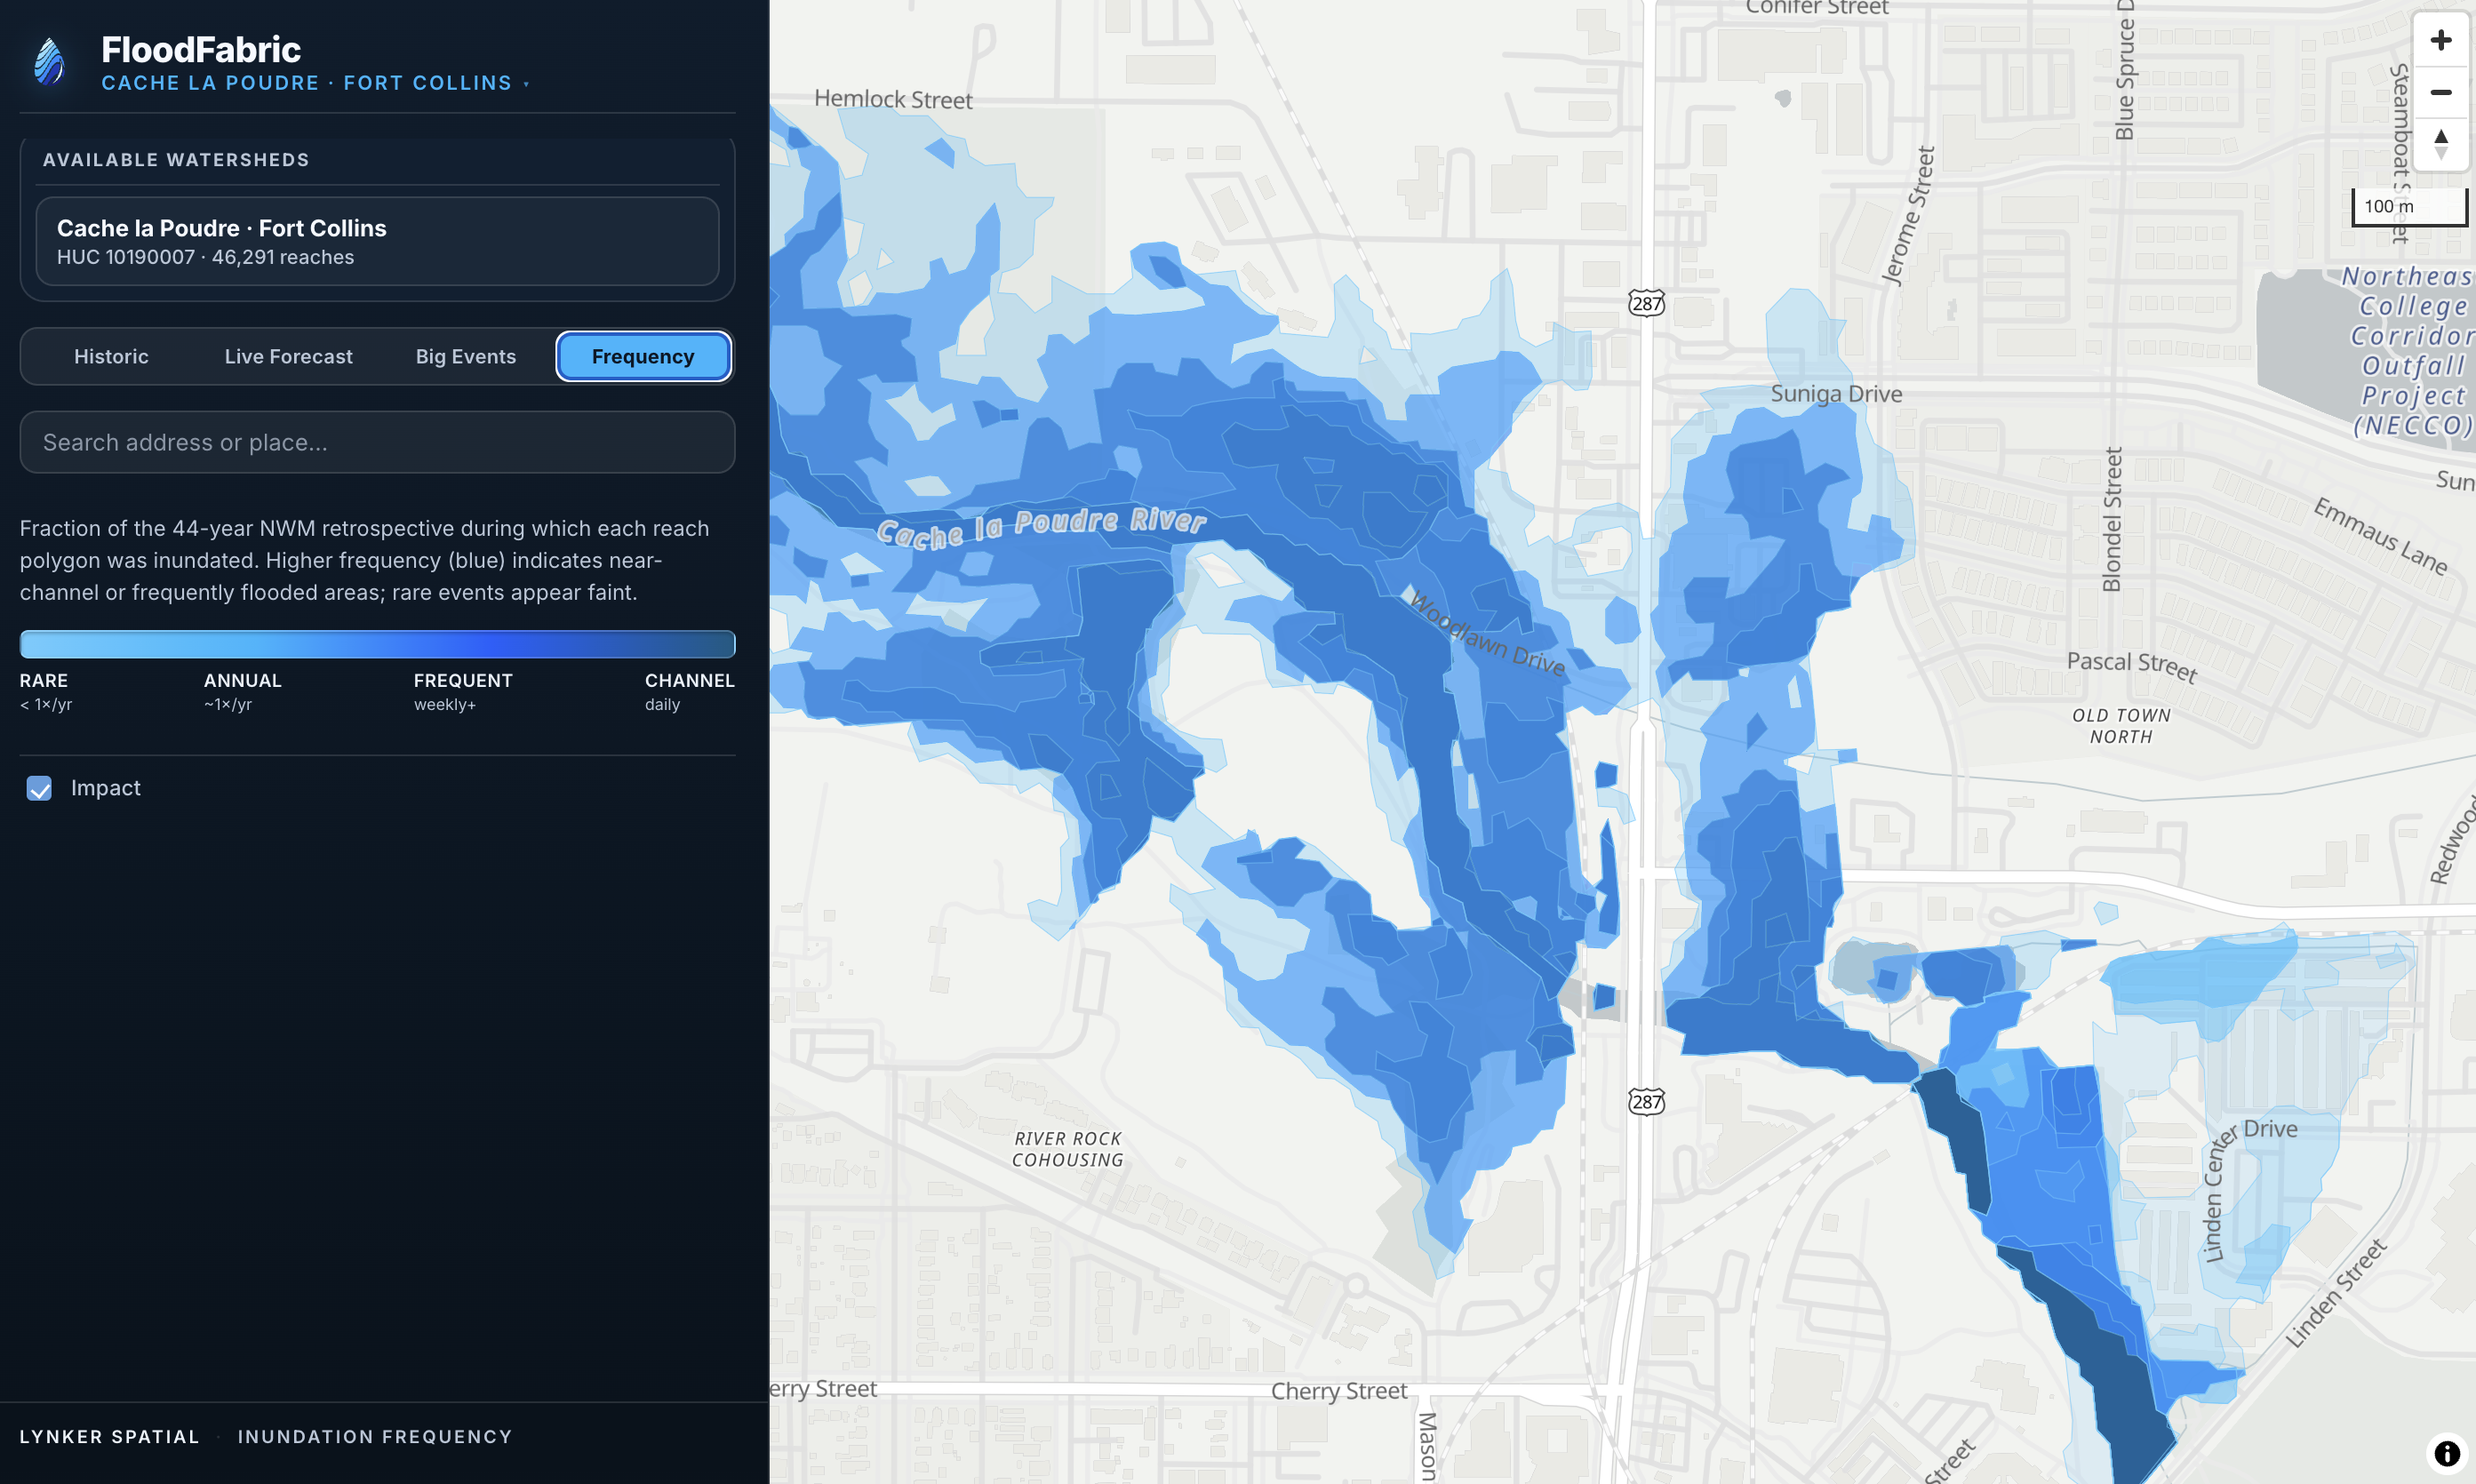
Across emergency management, infrastructure operations, environmental planning, and research.
The inundation layer can be driven by any model in the hydro-intel stack. That includes the NWM, RAS2FIM libraries, and FastPLN, but also custom Lynker Spatial simulations for locations where operational models underperform. Ungaged tributaries, snowmelt-dominated basins, regulated systems: wherever the off-the-shelf forecast isn't accurate enough, a validated site-specific simulation from Lynker Spatial Hydrology slots directly in as the upstream input. Better discharge in, better flood extent out.
Whether you need a pilot deployment, a retrospective analysis for a specific watershed, or a CONUS-scale inundation data feed, most conversations start with a scoping call. You describe the geography, the decision, and the timeline.